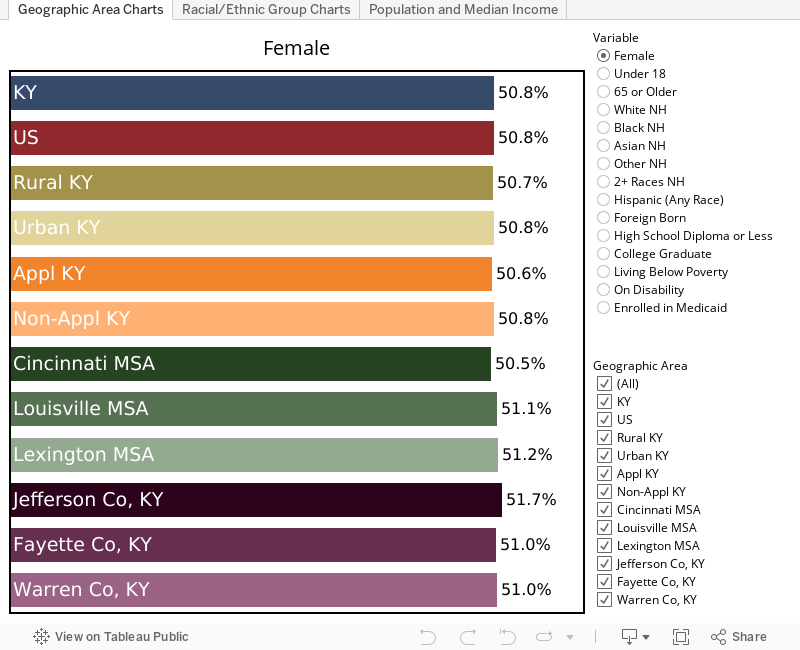
Population Subgroup Charts
Below are two workbooks that allow you to customize visualizations and download data for population subgroups in the US and Kentucky. Select the measure and/or subgroups you’re interested to redraw the charts. Once you have your variables chosen, click the download icon ![]() and select “Data” to download your customized dataset, or “Image” to export an image of the visualization.
and select “Data” to download your customized dataset, or “Image” to export an image of the visualization.
Social Determinants of Health (SDOH)
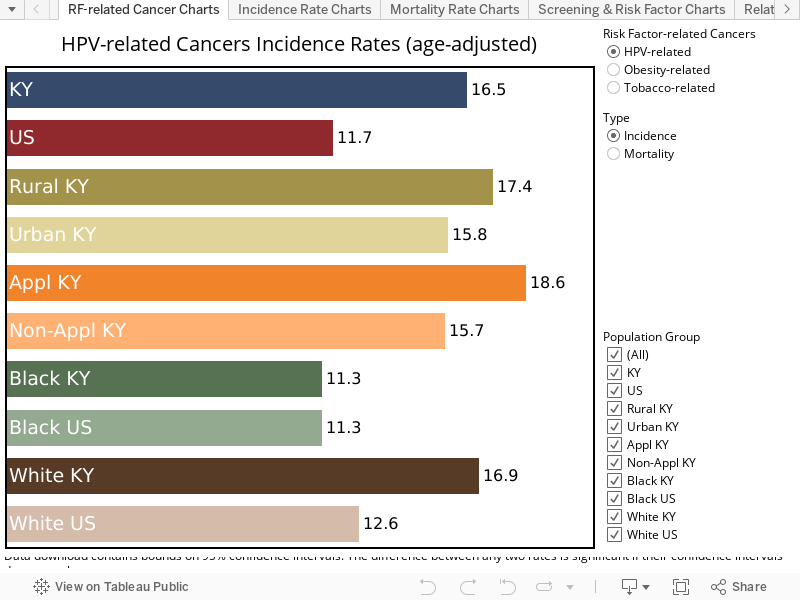
Cancer-related Outcomes
Note: Relative survival measures the percentage of people with cancer still living five years after diagnosis compared to a matching cancer-free population.
Suggested citation: 2021 Kentucky Cancer Needs Assessment [Internet]. University of Kentucky, Markey Cancer Center; 2022. Available from: https://www.kycancerneeds.org/